Cryptocurrency trading has become a popular option for investors and traders. For new traders, all the technical jargon can be quite intimidating and make diving into crypto trading difficult.
If you have been looking at crypto trading or investing, technical analysis is one of the main terms you will come across when looking at price predictions. Let’s try to demystify this term and understand how to use this analysis when trading and investing in crypto.

What is Technical analysis?
As the name suggests, technical analysis requires understanding the technical aspects of cryptocurrency. It refers to examining crypto trading activities by studying historical market data and using that information to predict future prices. It heavily relies on numbers and involves analyzing different patterns, signals, and trends using various tools and applying that knowledge to market price predictions.
Technical analysis of cryptocurrency enables traders to identify the overall trade in the crypto market, which in turn informs their entry and exit trade points and helps them manage their position sizing and risk exposure.
Assumptions of technical analyses
Technical analysis does now work in a vacuum but works by applying certain assumptions. Therefore, before using technical analysis on a cryptocurrency, it’s important to understand what these assumptions are.
Efficient Market Hypothesis
The efficient market hypothesis suggests that the market price mirrors the intrinsic value of a digital asset, and the current price reflects the collective knowledge and information available in the market about the cryptocurrency. Essentially, all factors influencing the cryptocurrency’s price are already accounted for in its market price. Indeed, this concept assists in assessing the aftermath of unexpected events by focusing on the price trajectory of a cryptocurrency. It serves as a valuable tool to evaluate the wisdom of investing in a specific coin based on its observed price trend.
Predictability
This assumption suggests that prices are not random and they follow certain trends, both short-term and long-term, and one can use these trends to predict future prices. Any future price movement will follow an established price trend.
History repeats itself
This assumption relies on human emotion. As we have already seen, the crypto market is repetitive, and traders tend to exhibit the same reaction to different market trends. Analyzing these patterns can give insight into future crypto behaviors.
Technical Analysis Indicators
There are various indicators you can use in performing a technical analysis of a cryptocurrency.
Moving averages
Moving averages are a popular indicator used to analyze the volatile crypto market and combining different moving averages can offer more valuable trading signals. It is based on analyzing the average price of a cryptocurrency over a certain period. For example, the moving average of Ether on any particular day can be determined by calculating the price of the coin for a number of trading days before that day.
There are three main moving averages one can use.
Simple Moving Average (SMA): The SMA calculates the average closing price of a coin over a number of days.
Weighted Moving Average (WMA): The WMA is a trend indicator produced by assigning greater weight to the more recent prices and works faster than the SMA. Most traders use the WMA to discover trends and trend reversals.
Exponential Moving Average (EMA): The EMA is similar to the WMA as it also focuses on current prices. It mainly focuses on smoothing out the price and eliminating short-term price fluctuations. The only difference between the EMA and WMA is the decreasing rate between two current prices (a current price and a preceding one) reduces greatly. Thus, the EMA responds faster to the latest price changes.
Moving average convergence divergence (MACD)
When looking at EMA one area worth mentioning is the Moving average convergence divergence (MACD). This is an oscillator (an indicator that fluctuates up and down based on a centered line) used to measure the difference between the 12th and 26th EMA days, forming the MACD line. The MACD line is used to signal when to buy or sell in that when the 12-day EMA goes below the 26 one it displays a sell signal and the other way around. The greater the distance between both on the MACD the stronger the reading.
Chart Patterns
Chart patterns are a graphical representation of price movements using lines and curves. They are sometimes described as a natural phenomenon because they fluctuate based on uncontrollable circumstances including human behavior.
Chart patterns are used to show different turning points or reversals that can indicate the price is about to and hence when it is time to buy or sell.
Candlestick Charts
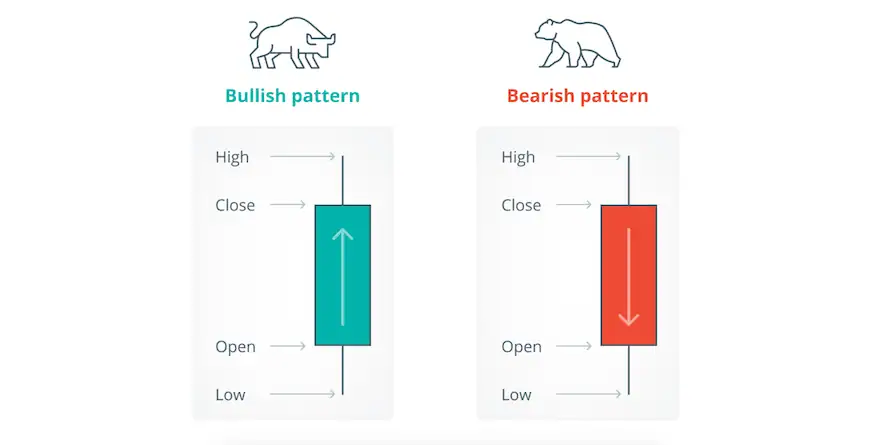
There are different types of chart patterns but in crypto trading, the candlestick chart is the most popular one because it reveals more information on price movements. Each candlestick on the chart indicates trading activity around your trading timeframe. They display four different price levels for every interval- high price, opening price, closing price, and low price.

The candlesticks have a body and wicks. The body of the candle changes between green and red to signal an increase and decrease in price. Green means the price is higher than it was at opening and red indicates the price is lower.
The candlestick’s wick indicates how high or low the price was within the trading time frame, with the peak showing the highest price and the base the lowest transaction price.
Support and Resistance

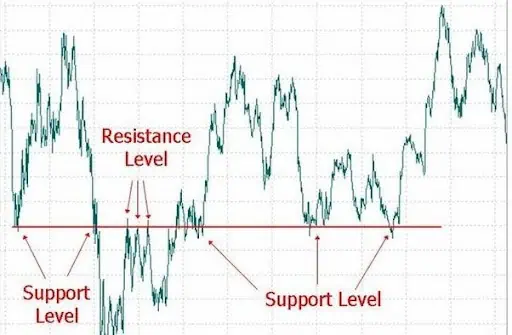
Support and resistance levels are diagonal and horizontal lines that aid in the interpretation of chart levels. A support level refers to the point where prices stop going lower, acting as floors that prevent the prices from further dropping. A resistance level, on the other hand, refers to the point where the prices can’t increase further and act as a ceiling to prevent the prices from skyrocketing.
One can get support from resistance levels using historical data and Fibonacci retracements. Support and resistance levels aid in signaling entry and exit trading points as they indicate where the price is likely to change direction.
Relative Strength Index
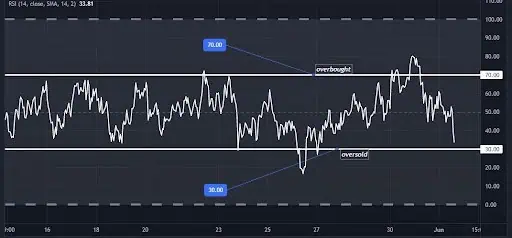
The Relative Strength Index (RSI) serves as an oscillator indicator gauging the extent of price movements. It measures both the velocity and magnitude of price fluctuations in a cryptocurrency, utilizing a scale from 0 to 100. This analysis assists in evaluating whether the cryptocurrency is undervalued or overvalued based on its current price dynamics.

The Relative Strength Index (RSI) is computed over a 14-day timeframe. When the RSI value of a cryptocurrency surpasses 70, it indicates that the asset is overbought, suggesting a ‘sell’ signal. On the other hand, when the RSI drops below 30 the asset has been oversold signaling ‘buy’.
Monitoring the Relative Strength Index (RSI) allows you to foresee potential reversals in the market. This insight aids in making more informed decisions regarding when to enter or exit trades, enhancing your overall trading strategy.
Trend Lines
A trend line is a line that connects high and low price points, and the more price points you can connect the stronger a trend becomes. Though a crypto’s past performance does not necessarily indicate its future performance, analyzing past trends is a critical tool that can give insight into future performance.
Bolinger Bands
Bolinger bands are technical analysis tools used to find out whether prices are high or low. Bolinger bands are measured by adding or deducting a standard deviation from the 20-day SMA (simple moving average). When the price is over the Bolinger band the cryptocurrency has been overbought and if it goes below it has been oversold.
1n examining the volume of cryptocurrency traded together with the price movements. This is valuable in understanding how the market works and how to make trading decisions.
In an uptrend, an increase in volume during price advances indicates strong buying pressure while a decrease in volume indicates the opposite. In a downtrend, an increase in volume as prices decline indicates strong selling pressure while a decrease in volume during price drops signals low selling pressure and potential trend reversal.
Volume analysis is not done alone and is usually done alongside other technical analysis indicators.
Using technical analysis to predict prices
Having established a foundational understanding of technical analysis indicators, we can utilize them to forecast potential future prices in the market using the steps below.
Have a trading plan
Before applying the indicators, you must already have a trading plan. A trading strategy is like a blueprint for your trading activities. It is designed to suit your risk appetite and expertise, keeping you focused and preventing you from giving in to every trading whim. Your trading plan should only change if and when you find a better trading strategy after careful analysis. Once you have a trading plan, you can pick the right technical analysis tools to use.
Choose a crypto to analyze
Once you’ve devised a trading strategy, the next step is to choose a crypto for analysis and potential trading. Accessing historical data for the chosen asset is relatively straightforward and can be found readily available online. This historical data is instrumental in conducting thorough analysis and making informed trading decisions.
Identify the trend
Trading strategies follow or go against a price trend, which means that you have to identify whether the coin is on an upward trend, a sideways trend, or a downward trend. Each trend is different and would be applied differently.
For example, if you opt to adhere to an upward-trending system, leveraging this trend to engage in buying or taking long positions within the market. This strategy involves capitalizing on the momentum of an ascending market trend to make trading decisions.
Apply support and resistance
As discussed above, support and resistance levels are great technical analysis indicators and can be used to design a better trading plan, identify different market trends, and inform your entry and exit points.
Identify entry and exit points
Using RSI, support and resistance, and other indicators can help traders determine trading entry and exit points. Understanding when to enter a trade and when to exit it can help in maximizing profits and minimizing losses.
Position sizing
Risk management enables you as the trader to make wise trading choices and one of the ways to do this is through position sizing. Position sizing involves determining the amount of crypto you are willing to risk when trading. By sizing your position you are better placed to know how much you will lose or make in a trade.
Position sizing involves setting an actual percentage or portion of your crypto asset that you intend to risk when trading. When sizing your position, you determine what percentage of your total account value you are willing to let go of in a trade while comparing the reward you intend to receive if the price changes. An indicator like the Average True Range is a fantastic way to analyze position sizing and decide your entry and exit trade points.
Make a trade
When all the elements align according to your analysis, it’s time to make a trading decision. Depending on your assessment, you can opt to buy, sell, or retain (hold) your digital assets within your portfolio based on your evaluation of the market conditions and your trading strategy.
Conclusion
Using various technical analysis indicators to trade decreases your chances of being blindsided should an expected event occur. However, you cannot use all the tools together. Using too many tools can create confusion, particularly when these indicators start to conflict. Additionally, these indicators cannot be used alone. Apply other tools such as fundamental analysis to gain a more comprehensive view. Above all, when in doubt, consult a trading professional.
Disclaimer: Investing can be quite a wild ride – especially when you don’t know the terrain! To keep things from getting too rocky, take some time beforehand to get familiar with all of the risks involved. Our site is here to up your investor game by providing all available intel about platforms and trends, but we don’t take responsibility nor can we be held accountable as advisors. That being said, it’s still important for you to make educated decisions that match what works best for YOU – just remember: no amount of savvy will guarantee success or protect against loss so invest money you can spare.


